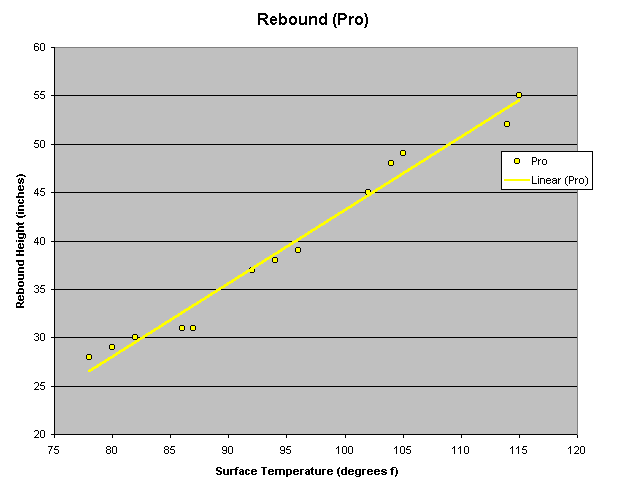
The following graph shows the rebound results for the Pro from the drop test. A linear regression trend line has been added.

The vertical axis shows the height of the rebound, in inches. The horizontal axis shows the surface temperature in degrees Fahrenheit. As surface temperature increases, rebound height increases. The Pro bounced 29” at 80f, and 55” at 115f. The Pro gained a little over ¾ of an inch in rebound height, for every degree its surface temperature increased.
Rebound Loss
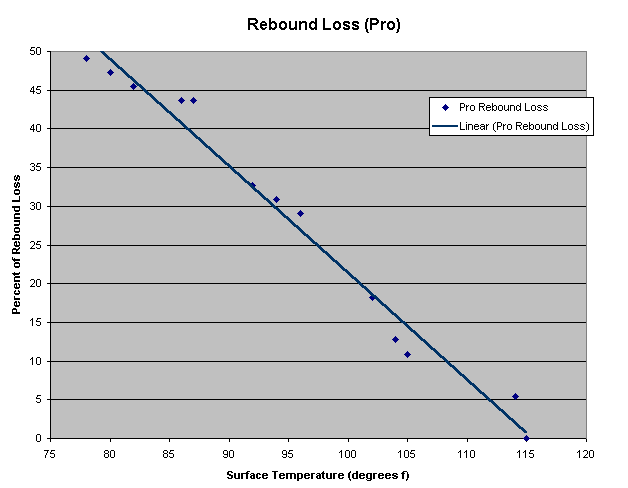
Another way to look at the Pro’s results is to see how much the rebound height decreased as a percentage of its maximum rebound height, as surface temperature decreased.

The vertical axis shows the decrease in rebound height as a percentage of the Pro's maximum rebound height. The horizontal axis shows surface temperature. At 100f, the Pro's rebound height was about 22% less compared to it's rebound height at 115f. At 90f, the Pro's rebound height was about 35% lower. At 80f, the Pro was bouncing a little more than half as high as it did at 115f.