Surface temperature was measure for 102 games in 59 different squash matches. Most of the balls measured were Yellow Dots, the rest were Pros. Skill level ranged from club players at the D level, to intercollegiate competitors at the A level.
The surface temperatures were recorded at 4 different venues. All the courts had ambient temperatures between 68f and 71f, and had panel walls.
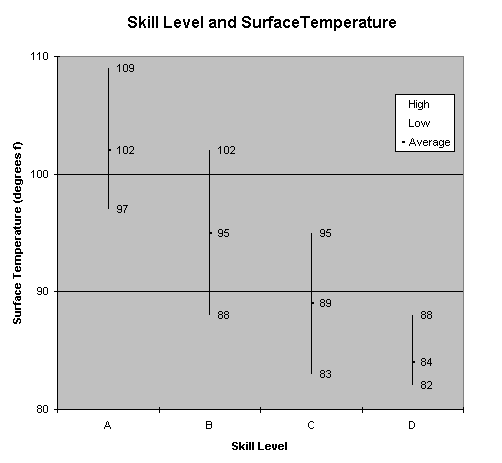
The following chart shows the average surface temperature for each skill level. The high and low surface temperature readings for each skill level are also shown.

The chart shows the general trend of surface temperature decreasing with decreasing skill level.
The following chart compares the average ball temperature of each skill level to the 113f benchmark of the WSF (see the section A Benchmark for Surface Temperature). The rebound height for each average surface temperature was taken from the results of the drop test on the Pro (see the section Rebound Results for the Pro), and then compared to the rebound height of the Pro at 113f. The comparison in rebound height is shown as a percentage.
Skill Level |
Average Surface Temperature |
Rebound Height (compared to the Pro at 113f) |
A |
102f |
-15% |
B |
95f |
-25% |
C |
89f |
-34% |
D |
84f |
-40% |
How hard the ball is hit, how often it is hit hard, and the length of the rallies greatly influenced the surface temperature. For example, consider the following two matches, played on the same court, under the same court conditions.
At an intercollegiate competition, the number one Women’s match between University of Pennsylvania’s Kate Patrick and Cornell’s Olga Puigdemont Sola had a surface temperature of 109f. The match was characterized by classic steady driving, with short balls on openings.
In contrast, the number one Men’s match, between Princeton’s Peter Yik (who is the 1999 intercollegiate champion) and Cornell’s Rajat Khanna, had a surface temperature of 98f. The match was played mostly as a touch game, with precise shooting from all over the court. The match was played on the same court, shortly before the number one Women's match.
Surface Temperature Increase
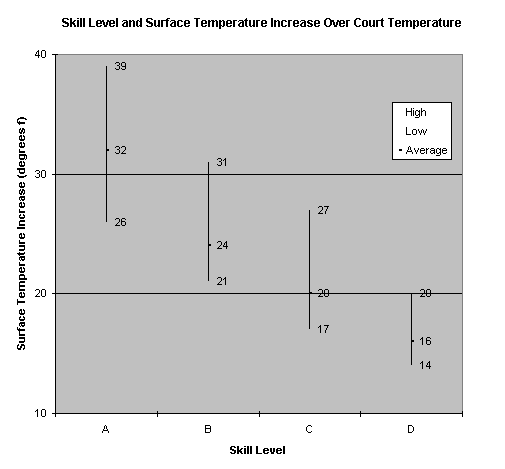
Another way to look at the surface temperature measurments is to see how much they increased over the ambient court temperature, as shown in the following chart.

The vertical axis shows how much the surface temperature increased over the ambient temperature of the court. The horizontal axis shows the skill levels.
The highest increase recorded was 39f. The lowest was 14f. According to the rebound loss graph for the Pro (see the section Rebound Results for the Pro), this 25f difference is over a 35% decrease in rebound height.
The charts on this page show measurements from a relatively small sample of players, who are widely categorized, all on similar courts under similar conditions. Players may get different surface temperatures, depending on their ability, style of play, court construction, and court temperature.
None of the players measured got a Yellow Dot or Pro to the 113f benchmark (see the section A Benchmark for Surface Temperature). The ambient court temperature range of 68f-71f and panel walls may have been contributing factors to this observation. One measurement was taken at a professional exhibition match (Mark Chaloner vs Paul Johnson). The surface temperature was 108f, the ambient court temperature was 69f. The match was played on a court with panel walls.